Equity Position of U.S. Households Improves

June 6, 2014

The Federal Reserve Board of Governors’ recently released statistics on the financial accounts of U.S. households. The release shows continued improvement in the financial position of U.S. households with real estate. In fact, the household real estate equity position improved to a level last reached in the second quarter of 2007.

According to NAHB tabulations of the quarterly series, the asset value or market value of owner-occupied real estate held by U.S. households increased by $758 billion dollars or 3.9%. The liability total – home mortgages – decreased by $37 billion or 0.4%. The equity position, the difference between assets and liabilities, increased by $795 billion or nearly 7.9%.

Chart1

The figures provided by the Federal Reserve Board of Governors are not adjusted for inflation. Therefore, it is useful to examine the owners’ equity in real estate as a percentage of household real estate. The ratio is calculated by taking the equity position divided by the market value of owner-occupied real estate held by U.S. households. The higher the ratio the more favorable is the financial position of U.S. households with real estate.

Chart2

The current ratio of owners’ equity in real estate as a percentage of household real estate is 53.6%. The ratio was last at this level in the first quarter of 2007. The ratio has rebounded rapidly since the first quarter of 2009 when it was at an all-time low of 36.6%.

The quarterly series shows continued improvement in the balance for U.S. households with real estate. This should not be a surprise given the increase in home prices and the low mortgage rates. The continuing improvement in the financial position of U.S. households with real estate is a welcome sign. The improved equity position represents fewer underwater homeowners, thereby unlocking housing supply and demand.


Consumer Debt Expands on Mortgages, Student and Auto Loans

May 15, 2014

The Federal Reserve Bank of New York recently reported that aggregate consumer debt, which includes mortgages, rose by 1.1% or $129 billion over the first quarter of 2014. There is now an estimated $11.7 trillion in aggregate consumer debt outstanding. Total consumer indebtedness has now risen for 3 consecutive quarters; however, it still remains 8.1% below its peak of $12.7 trillion that was reached in the third quarter of 2008.

Growth in aggregate consumer debt reflected quarterly increases in student loans, mortgages, and auto loans. According to Figure 1, student loans rose the fastest, increasing by 2.9% over the quarter, while both mortgage debt and auto loans outstanding expanded by 1.4%. However, mortgage debt outstanding accounted for the largest portion of the $129 billion increase in aggregate consumer debt, $116 billion, because it represents 70.1% of all consumer debt outstanding. Mortgage debt outstanding has now increased in three consecutive quarters, rising by $324 billion or 4.1% over that period. The increases in these three consumer debt categories were partly offset by declines in home equity lines of credit, other consumer debt, and credit card debt, with credit card debt outstanding contracting the most. Other consumer debt includes consumer finance (sales financing, personal loans) and retail (clothing, grocery, department stores, home furnishings, gas, etc) loans.

Presentation1

The first quarter decline in credit card debt follows a recent period of nearly imperceptible growth. The most recent iteration of the Federal Reserve Board’s Senior Loan Officer Opinion Survey contained a set of special questions about factors that affected banks’ consumer credit card loan growth because it noticed that “after contracting for several years, credit card loans on banks’ books grew modestly in 2013, a bit less than 1 percent,amid a moderate pace of expansion in economic activity.” In contrast, “between the years 1998 and 2007, the Federal Reserve Board’s Assets and Liabilities of Commercial Banks in the United States showed that aggregate consumer credit card loans on banks’ books grew about 6 percent annually, on average.”

The results of these special questions are shown in Figure 2. According to the figure, senior loan officers believe that the factors constraining credit card growth include heightened federal government regulation via the Credit CARD Act of 2009, changing preferences for credit card debt, and the prevalence in consumers’ use of substitute payment methods. The Credit CARD Act of 2009 is notable for introducing a series of restrictions on banks’ credit card lending activity. For example, the Credit CARD Act of 2009 required banks to apply credit card payments made by consumers to the debt with the highest interest rate. These restrictions were aimed at strengthening consumer protections, but they also restricted the revenue that banks could collect from credit card accounts.

According to the figure, a net fraction of 51.2% of senior loan officers believed that the Credit CARD Act of 2009 was constraining growth in credit card debt outstanding while a net fraction of 38.9% of senior loan officers believed that consumers’ preferences for debt levels were constraining this growth. Consistent with the perception of a weaker preference for debt, a net fraction of senior loan officers also noted that growth of credit cards debt outstanding was constrained by consumers’ use of substitute payment mechanisms such as debit cards and other payment mechanisms, as well as their tendency to use credit cards for transactional use only.

Presentation2


Consumer Credit Expands, But At a Slower Rate

March 10, 2014

The Federal Reserve Board recently reported that growth in consumer credit outstanding decelerated in January 2014. Total consumer credit outstanding rose by 5.3% on a month-over-month seasonally adjusted basis, but the January growth rate was 0.9 percentage points less than the 6.2% growth rate that took place in December. There is now $3.1 trillion in total consumer credit outstanding.

The slowdown in consumer credit growth reflected a monthly decline in revolving credit. According to the release, revolving credit, which largely measures consumer credit card debt, fell by 0.3% in January after rising by 4.3% in December. As Figure 1 illustrates, the decline in revolving credit was generally widespread amongst major revolving credit holders. Revolving credit held by depository institutions fell by $18.9 billion while finance companies saw their revolving credit holdings shrink by $2.4 billion. Revolving credit held at credit unions and nonfinancial businesses also fell. Only revolving credit held in pools of securitized assets saw a monthly increase. However, these pools, which are outstanding balances upon which securities have been issued, accounted for 4% of revolving credit outstanding. Neither the federal government nor nonprofits and educational institutions hold revolving credit.

Presentation1

Overall, the decline in revolving credit was more than offset by an increase in non-revolving credit. The release indicates that non-revolving credit, which is largely composed of auto and student loans, rose by 7.5% in January, 0.6 percentage points faster than the 6.9% growth that took place in December. However, much of the January increase in non-revolving credit was not held by the institutions that also hold revolving credit. Rather, it was held by institutions that do not engage in revolving credit lending.

As Figure 2 illustrates, total non-revolving credit rose by $33.1 billion, more than offsetting the $21.6 billion decline in total revolving credit outstanding. However, $27.6 billion, 83.4%, of the $33.1 billion increase in non-revolving credit was held by the federal government, non-profits, and education institutions. The remaining $5.5 billion was held by institutions that also hold revolving credit and only partially offset the decline in revolving credit that was held by this group. The release indicates that while total non-revolving credit growth more than offset total revolving credit decline, leading to an overall increase in consumer credit outstanding, this phenomenon did not take place at the institutional level. Instead, institutions holding revolving credit saw their net holdings of consumer credit shrink while institutions that only hold non-revolving credit saw their consumer credit holdings grow.

Presentation2


House Prices End the Year Higher

February 25, 2014

Data from Standard and Poor’s indicates that house prices rose in December 2013. According to the release, the seasonally adjusted S&P/Case-Shiller HPI – 20 City Composite rose by 0.8% in December 2013. This is the 23rd consecutive month-over-month increase for the Index. Over this time period, the Index has risen by 21.7%. For the entire year of 2013, the 20 City Composite Index grew by 13.4%.

The Federal Housing Finance Agency (FHFA) also released data on house prices. According to its seasonally adjusted House Price Index – Purchase-Only, house prices rose by 0.8% in December 2013. The FHFA House Price Index – Purchase-Only has now increased for for 24 of the past 26 months, rising by 14.8% during this period. Over the year, the FHFA House Price Index – Purchase-Only has climbed by 7.7%. As Figure 1 shows, following the 15.3% increase in the FHFA House Price Index – Purchase-Only that took place between April 2011 and December 2013, house prices are roughly the same as the level recorded in May 2005 and are now at 92% of the peak level reached in March 2007.

Presentation1

A previous post demonstrated that the recovery in house prices is a key contributor to the renewed expansion in housing equity. In a related fashion, rising house prices should also help expand the amount of homeowners with positive housing equity, shrinking the amount with negative housing equity. Figure 2 juxtaposes the FHFA House Price Index – Purchase-Only data displayed in Figure 1 onto a chart depicting the share of homes with negative housing equity. According to this chart, house prices in December 2011 were at 81% of their March 2007 peak. By September 2013, house prices reached 91% of this peak level. At the same time, the share of homes with negative equity reached 25.2% by the end of the fourth quarter of 2011. However, by the end of the third quarter of 2013, the share of homes with negative equity had fallen to 13.0%. Given that the FHFA House Price Index – Purchase Only ended the fourth quarter of 2013 at 92% of its peak, the share of homes with negative housing equity is expected to end the year even lower.

Presentation2

For full histories of the composites and 20 markets included in the Case-Shiller composites, click here cs.

For full histories of the FHFA US and 9 Census divisions, click here.


Income Growth Lagging Balance Sheet Improvements

September 26, 2013

During the second quarter of 2013, household balance sheets improved with increases in home values and reductions in mortgage debt, boosting household net worth. Since the 4th quarter of 2011, the aggregate value of owner-occupied real estate is up nearly $2.8 trillion.

However, while balance sheets in aggregate have mended since the end of the Great Recession, income growth continues to lag. The future of housing demand will be determined by, among other factors, income growth for existing workers and employment opportunities for newly forming, younger households. This will be particularly true as the share of cash buyers for existing and new homes recedes in the year or two ahead.

HH balance sheets.png

Household balance sheet repair proceeds nonetheless. The graph above plots the current value of net worth to disposable personal income (NW/DPI) and the corresponding 25-year historical average (1982-2007). The dashed blue line charts the personal savings rate. Household net worth data are from the Federal Reserve’s Flow of Funds and the savings rate and disposable income data come from the Bureau of Economic Analysis National Income Product Accounts (NIPA).

After data revisions, as of the second quarter of 2013, the NW/DPI measure stood at a value of 6.03, above the historical level of 5.38 and significantly higher than the cyclical low of 5.13 set during the beginning of 2009. These improvements resulted in pushing the savings rate down after rising during the financial crisis and reducing household consumption.

Flow of Funds data from the first quarter of 2013 show that total home mortgage debt also continues to decline. Since the first quarter of 2008, home mortgage debt has fallen 12% or $1.32 trillion. And due to rising home prices, the value of owner-occupied homes has risen since the last quarter of 2011 by $2.8 trillion.

Home value and debt

Due to these improvements for household balance sheets, another challenge brought about by the Great Recession is a greater obstacle to future economic expansion: lagging income growth.

NIPA data for disposable personal income (blue line below) show that a gap has opened between current levels and the 2000-2003 trend (red line). More job creation and additional income growth will, if realized, help support housing demand going forward.

DPI


Consumer Credit Expands On Auto, Student Loans

September 11, 2013

Data released by the Federal Reserve Board indicates that consumer credit continued to expand in July, albeit at a slower pace than in the recent past. According to the Federal Reserve’s G.19 survey, consumer credit outstanding grew at a seasonally adjusted annual rate of 4.4% and now stands at $2.9 trillion. However, the growth in consumer credit outstanding recorded in July was 0.7 percentage points less than the 5.1% growth rate recorded in June and 2.4 percentage points less than the 6.8% growth rate recorded in May.

The expansion in consumer credit reflects a rise in non-revolving credit, but the growth rate in non-revolving credit slowed over the month. An earlier post illustrated that non-revolving credit is largely composed of auto and student loans. In July, non-revolving credit outstanding grew by 7.4%. However, the July growth rate of non-revolving credit was 2.0 percentage points slower than the growth rate recorded in June.

The rise in non-revolving credit was partially offset by a decline in revolving credit. This is the second consecutive month that revolving credit, which is largely made up of credit cards, fell. However, the rate of decline in July was smaller than the rate recorded in June. According to the release, revolving credit declined by a seasonally adjusted annual rate of 2.6%. In June, revolving credit fell by 5.2%.

Household debt data from the Federal Reserve Bank of New York indicates that historically, the amounts of credit card and auto loan debt outstanding were roughly similar. According to Chart 1, in the first quarter of 2003, the FRBNY estimated $641 billion in auto loans outstanding and $688 billion in credit card debt outstanding. By the first quarter of 2011, following the boom and bust experienced in the U.S. economy, auto loans outstanding totaled $706 billion while credit card loans equaled $696 billion. However, since the first quarter of 2011, the amount of auto loans outstanding has begun to increase while the level of credit card debt outstanding continues to decline. In the second quarter of 2013, the latest data available, auto loans outstanding had risen to $814 billion while credit card debt outstanding had fallen to $668 billion.

Presentation1

A previous post illustrated that the decline in credit card debt outstanding reflects a decrease in both the number of open credit card accounts and in the average amount outstanding. Conversely, both the number of auto loans and the average loan amount are climbing, but the average loan amount has risen more. The growth in the number of accounts and in loan size reflects consumers’ ability and willingness to finance car purchases. %. In contrast, the observed increase in mortgage demand is not being met with easier lending standards, holding back a more robust housing recovery. As chart 2 below illustrates, after dipping to 79.8 million accounts in the second quarter of 2011, the number of auto loan accounts has risen by 5.4% to 84.0 million accounts. Meanwhile, the average auto loan, calculated by dividing the total amount of auto loans outstanding by the total number of accounts, has risen by 11.9% since it reached its trough in the first quarter of 2010. Since the second quarter of 2011, when the number of auto loan accounts began to rise, the average auto loan has increased by 9.3%.

Presentation1


Mortgages Less Likely to Become Seriously Delinquent

August 20, 2013

Data released by the Federal Reserve Bank of New York indicates that aggregate consumer debt outstanding, which includes mortgages, contracted by 0.7% or $78 billion on a not seasonally adjusted basis in the second quarter of 2013. This is the second consecutive quarter that aggregate consumer debt has declined on a quarter-over-quarter basis and the 7th decline in the past two years. Over the past four quarters, which lessens the influence of seasonal factors, aggregate consumer debt outstanding has declined by 2.0% or $231 billion. Aggregate consumer debt outstanding has declined on a 4-quarter basis in every quarter since the fourth quarter of 2008. Overall, since reaching a peak in that quarter, aggregate consumer debt has contracted by 12.0% or $1.5 trillion.

According to the data, the decline in total consumer debt largely reflected a contraction in mortgage debt outstanding. Mortgage debt outstanding, which accounted for 70.3% of aggregate consumer debt in the second quarter of 2013, fell by $306 billion, 3.8%, over the past year. Credit card debt fell by another $4 billion, 0.6%, and other consumer debt, which includes consumer finance loans such as personal loans and retail debt such as department store loans, was lower by $16 billion or 5.1%. These declines were partially offset by continued growth in auto loans and student loans. Over the past year auto loans have expanded by $64 billion, 8.5%, and student loans have grown by $80 billion or 8.8%.

Mortgage debt outstanding falls when, on net, consumers either pay off or default on their mortgage. A previous blog post illustrated that a small portion of mortgages 30-60 days late reach the default stage, but the likelihood of default becomes all but certain if a mortgage becomes 90 or more days late. As a result, determining the likelihood that a mortgage moves from the 30-60 days late stage to the 90 or more days late stage can help analysts anticipate future mortgage defaults. A declining rate of transition from 30-60 days late to 90 or more days late suggests that mortgage defaults are having a shrinking impact on the amount of mortgage debt outstanding.

Presentation1

The chart above shows that the transition rate of mortgages 30-60 days late to 90 or more days late, which averaged 14.0% between 2003 and 2006, peaked at 44.2% in the first quarter of 2009 but has since declined to 19.8%. An increase in the transition rate from 30-60 days late to 90 or more days late means that a smaller share of mortgages that are 30-60 days late either “cure” or remain in this stage. According to the chart, the percentage of mortgages remaining 30-60 days late declined between 2006 and 2009, but the “cure” rate fell even more. After dropping to 20.5% in the third quarter of 2009, the “cure rate” has since risen to 35.8%, but it is still 8.1 percentage points below its 2003-2006 average. The residual, the portion of mortgages remaining 30-60 days late, has climbed 11.5 percentage points to 44.4% and is 2.3 percentage points above its 2003-2006 average.


The Impact of Rising Interest Rates on Housing Affordability

August 5, 2013

According to Freddie Mac, the average interest rate on a 30-year fixed rate mortgage rose by 8 basis points over the week to 4.39%. Since the beginning of the year, mortgage rates have risen by about 1 percentage point and are now at a level last seen in August 2011.

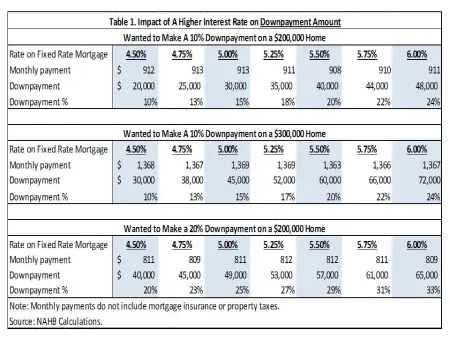
The rapid rise in mortgage interest rates could affect housing affordability through higher monthly mortgage payments. However, monthly mortgage payments are not the only path by which rising interest rates can affect affordability. Homebuyers can instead decide to raise their downpayment amount in order to maintain an otherwise constant monthly payment in the face of rising rates.

Table 1 shows the impact of rising mortgage rates on downpayments for this scenario. As interest rates rise, homebuyers increase their downpayment in order to keep monthly mortgage payments roughly the same. However, the required increase in the downpayment, both in levels and as a share of the house price, declines as mortgage rates rise. If the downpayment remained at 10% even as mortgages rates rose, then the monthly mortgage payments on a $180,000 mortgage, $912 at a 4.50% mortgage rate, would rise to $994 if mortgage rates rose to 5.25% and to $1,079 if mortgage rates rose to 6.0%.

Presentation1

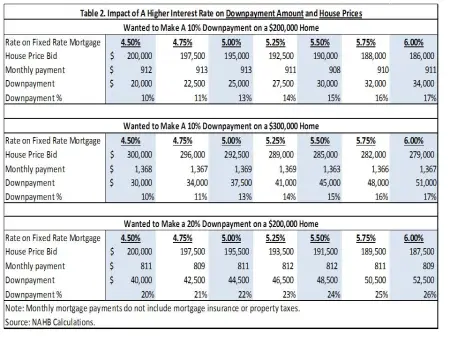
Alternately, homebuyers seeking to maintain affordable monthly mortgage payments may lower their bid price on a home. In aggregate, lower bids that are accepted by house sellers could depress house price growth, partly offsetting recent gains.

Table 2 assumes, as an example, that the total cost of higher mortgage rates is evenly split between a lower bid and a higher downpayment in order to maintain affordable monthly mortgage payments. the required downpayment percent rises as in Table 1 but at a slower rate.

Presentation2

This exercise illustrates that rising mortgage rates can increase monthly mortgage payments, but a larger downpayment can offset this effect. However, accumulating a larger downpayment may be difficult, especially for recent homeowners with little home equity, as well as first-time home buyers.

These numbers illustrate a large issue challenging the demand side of the housing market, which is connected to the issue of pent-up housing demand. Obtaining a mortgage to buy a home, including accumulating the necessary downpayment, is in many ways a greater hindrance for the market than recent rate increases.

Regardless, rising mortgage interest expense by homeowners is a reminder of the importance of the mortgage interest deduction  (MID) in terms of supporting housing demand. As prospective homebuyers face larger interest payments, the value of the MID increases.


House Prices See Steady Gains

July 23, 2013

Nationally, house prices continued to rise in May, contributing to the overall recovery for U.S. housing markets. According to the most recent release by the Federal Housing Finance Agency, U.S. house prices rose by 0.7% on a month-over-month seasonally adjusted basis in May. This is the sixteenth consecutive monthly increase for the House Price Index – Purchase Only. Since January 2012, house prices have risen by 10.4%.

The May increase in house prices was geographically widespread, increasing in every division of the country. As the chart below illustrates, the largest month-over-month gains took place in the Pacific and Mountain divisions, regions of the country containing states like Nevada and California that experienced the largest price declines in recent years.

Presentation1

The recovery in house prices has contributed to the ongoing repair in household balance sheets. In aggregate, rising house prices and falling mortgage debt have resulted in greater housing equity and household net worth. At the same time however, disposable personal income declined in the first quarter of 2013 due to factors such as higher payroll taxes. If disposable personal income growth continues to lag house price appreciation, then potential first-time home buyers may find their ability to buy a home more difficult.

For full histories of the FHFA US and 9 Census divisions, click here.


Soaring Revolving Credit May Not Indicate Strengthening Consumer Demand

July 9, 2013

The Federal Reserve Board reported that the total amount of consumer credit outstanding grew by a seasonally adjusted annual rate of 8.3% to $2.8 trillion in May, as debt associated with student and car loans, as well as credit card debt rose.

In April, consumer credit outstanding rose by 4.6%. The month-over-month increase in consumer credit outstanding reflected acceleration in the growth of both revolving and non-revolving credit. Revolving credit, which is largely composed of credit cards, rose by 9.3% in May after increasing by an upwardly revised rate of 1.1% in April. Meanwhile, non-revolving credit, which is largely composed of student and automobile loans, climbed 7.9%, 1.7 percentage points faster than April’s downwardly revised growth rate.

The May data represents the first time that the month-over-month rise in revolving credit has outpaced growth in non-revolving credit since May 2012.

The recent growth in revolving credit may not be confirming evidence of stronger consumer demand. On the one hand the increase in consumers’ use of credit cards may reflect growing confidence in the economic recovery. On the other hand, consumers may be increasing their use of revolving credit in order to offset lower disposable income due to factors such as higher payroll taxes.

Presentation1