Economists Agree That Housing Recovery Likely To Continue

April 24, 2014

Yesterday, NAHB hosted its bi-annual Construction Forecast Webinar (CFW). The CFW featured three industry experts. NAHB Chief Economist David Crowe was joined by Maury Harris, Chief US Economist at UBS, and NAHB Senior Economist Robert Denk to present views on the outlook for the US economy and the housing market more specifically.

Here are the major points from the presentation:

David Crowe, Chief Economist at NAHB, highlighted the importance of an improved economy for a continuation of the housing market recovery. Recent growth in GDP and payroll employment as well as a decline in the unemployment rate were cited as evidence of current economic strength, and these trends are expected to continue. The demand side of the housing market equation has shown signs of improvement. Consumers have expressed greater confidence and have followed up this sentiment by purchasing durable goods such as home furnishings and automobiles. Despite slightly higher interest rates, housing remains affordable. Nevertheless, home builders still face significant headwinds. These include lot supply and labor availability. Credit access has improved, but likely hasn’t returned to normal. However, these supply-side constraints should recede over time. Taken together, improving economic fundamentals combined with a more optimistic consumer and an increasing need for new homes should support a continuing recovery in the housing market.

Maury Harris, Chief US Economist at UBS, expressed the view that a housing market recovery and broader economic recovery will depend on the availability of credit. He noted that banks currently have about $2 trillion in lending capacity courtesy of monetary policy, but that lending standards remain tight. As the risk associated with lending shrinks, banks will increase their willingness to lend, which should support job growth. He presented evidence that the easing process may have already begun; financial market measures of risk are declining and lending standards are beginning to ease. Ultimately, as the employment situation improves, especially for “millennials”, household formations should expand and pent-up demand should be released, resulting in greater home sales and higher home prices. As a result of eased lending standards and an expanded capacity to lend, both the housing market and broader economy are expected to strengthen.

Robert Denk, Senior Economist at NAHB, agreed with the general consensus that the housing market recovery should strengthen over the next few years, but noted that the recovery will vary across the country. The regional variation partly reflects the depth of each state’s housing market contraction. States where the contraction was greater will take longer to recover, while states that experienced a relatively shallow decline will recover more quickly. Second, the extent of the housing bubble, symbolized by a house price-to-income ratio, varied amongst states. States such as Florida and Nevada experienced a ratio that was double their longer-term average while states such as Wyoming and Kansas saw their ratio peak at less than 20% above their long-term average. Regional variation will also be affected by foreclosures, both the level of foreclosures and the speed of the foreclosure process. States with a larger foreclosure inventory will take longer to rebalance supply and demand and return to normal levels of production. At the same time, eliminating the foreclosure inventory is more difficult in states that have a judicial process in place to govern foreclosures.  Finally, regional variation will result from the strength of each state’s underlying economy. Housing production will be better supported in states with a more robust rate of economic growth.


Housing Production Ends the Year Strong

January 17, 2014

Housing starts in December were at a seasonally adjusted annual rate of 999,000, according to estimates from the Census Bureau and Department of Housing and Urban Development. In addition, the November level was revised up by 1.5% to a 1,107,000 annualized rate. As a result, the December reading was 9.8% below this revised November estimate, but 1.6% above the pace of housing starts recorded in December 2012.

Presentation1

Despite the month-over-month decline, housing production ended the year in a relatively strong fashion. The annualized rate of housing starts recorded in December exceeded the level recorded for all of 2013, 923,000, by 8.2%. The December recording of total housing starts was also the third highest level in 2013 behind the 1.1 million starts recorded in November and 1 million starts registered in March.

Moreover, on a 3-month moving average basis, one method used to identify an underlying trend, housing starts rose by 4.4% in December, eclipsing 1million for the first time in 2013. The 3-month moving average of total housing starts last exceeded 1million in June 2008.

The Census estimates for 2013 demonstrate it was a positive one for home building. Total housing starts are estimated to come in at 923,000, 18% higher than 2012. Multifamily starts are estimated to total 306,000, a nearly 25% jump over 2012. And single-family starts grew 15% over 2012 to 618,000.

Going forward, housing starts should continue to show progress as pent-up demand is unlocked and the labor market improves.  The NAHB/Wells Fargo Housing Market Index is consistent with this forecast, coming in a level of 56 in January – the eighth consecutive month above the key level of 50.


October Housing – Permits Strong, Starts Delayed

November 26, 2013

The Census Bureau reported on building permits, but the housing starts data has been delayed until December 18 due to the partial federal government shutdown in early October. The pace of building permit issuance rose to a seasonally adjusted annual rate of 974 thousand in September and rose again to 1,034 thousand annually in October. The pace of August permitting was revised up to 926 thousand annually.

Single family permitting continued its steady progress at a pace of 620 thousand annually in October, but the strength in today’s report was concentrated in the multifamily sector where permitting surged to 414 thousand units annually.

That’s according to the permits data (issued by local jurisdictions) but it’s worth noting that the composition of activity is likely to change when we see the actual starts data in December. The single family starts are likely to reflect stronger growth than seen in the permits data because building in non-permit issuing areas is included in the starts data, and some permits are reclassified from multifamily to single family when started.

The reclassifications occur when local jurisdictions define some configurations multifamily (e.g., townhouses) but the Census Bureau treats them as single family. These reclassifications boost single family starts relative to permits and depress multifamily starts relative to permits.

Overall, today’s report is a positive signal that the government shutdown and the uncertainty surrounding the ongoing negotiations to keep the government running have not yet taken a toll on the housing market recovery, but we’ll see how much of that strength is sustained in December’s housing starts report and in the months ahead.


Porches on 90% of New Homes in 4 Southern States

August 23, 2013

There is a clear geographic pattern to the exterior amenities (porches, patios and decks) included on new homes, according to data from the Survey of Construction (SOC).  Among Census divisions, the highest incidence of one of these amenities occurs in the East South Central (the four southern states of Alabama, Kentucky, Mississippi and Tennessee), where 90 percent of the new homes started in 2012 had porches.

The SOC is conducted by the Census Bureau, partly funded by HUD, and the source of the familiar series on housing starts.  Traditionally, it has provided detail only for the four Census regions.  But since 2009, in a move strongly endorsed by NAHB, the Census Bureau has made detail for the nine Census divisions available.  Since then, at least 90 percent of homes in the East South Central division have been built with porches.  At the other extreme, the share of new homes with porches in the Middle Atlantic (New Jersey, New York and Pennsylvania) has been under 50 percent every year.

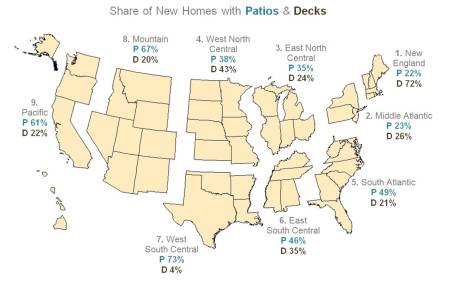
The map below shows the geographic breakdown of patios and decks on single-family homes started in 2012:

Patios_Decks

As of 2012, patios are most common on new homes in the West South Central, followed by the Mountain and Pacific divisions.  Patios are least common in New England, followed by the Middle Atlantic and East North Central.  These rankings have remained relatively stable since 2009, although the adjacent Mountain and West South Central divisions have changed places at the top of the list.

While patios are less common on new homes in New England than other divisions, that is where decks are most common (included on 72 percent of  homes started in 2012), followed at a distance by the West North Central (43 percent) and East South Central (35 percent).  Decks are comparatively uncommon in the West South Central.  Elsewhere, 20 to 26 percent of the new homes have decks.  These geographic tendencies have also remained relatively stable since 2009.

These and other characteristics of new homes started in 2012 are described in more detail in a recent HousingEconomics.com Special Study.


Single-Family Starts Hold Steady as Multifamily Drops

July 17, 2013

The U.S. Census Bureau reported that housing starts were at a seasonally adjusted annual rate of 836,000 for June, a 9.9% slower pace than May but 10.4% higher than one year ago.

The month-over-month decline in housing starts largely reflected a 26.2% decrease in multifamily starts, which came in at a seasonally adjusted annual rate of 245,000 in June.

Single-family housing starts, which accounted for 71% of all housing starts in June, were generally flat. Between May and June single-family starts fell by 0.8% to a seasonally adjusted annual rate of 591,000. Over the past twelve months, single-family housing starts are up 11.5%.

Multifamily housing starts typically experience month-to-month volatility. On a 3-month moving average basis, which smoothes the volatility, multifamily housing starts have been generally declining since March, with the three month moving average having fallen by 15.0% over the period.

Going forward, single-family starts should continue to grow, consistent with the recent rise in the NAHB/Wells Fargo Housing Market Index, a measure of single-family builder confidence. NAHB forecasts that single-family construction will be up 20% for 2013. Future data will provide a clearer picture of the growth prospects of the multifamily sector.

Presentation1


Solid February for Housing Starts

March 19, 2013

Housing starts for February came in at a healthy pace for both single and multifamily units. Single family housing starts in February ran at a 618 thousand annual pace (SAAR) while multifamily starts came in at 299 thousand. This represents a continuation of the solid growth trajectory in single family starts that began in earnest in late 2011 and carried through 2012. Multifamily starts tend to be more volatile but have trended upward since hitting bottom in late 2009 and have outpaced single family production in the housing market recovery.

Issuance of new building permits is on track to sustain the current levels of production and we expect going forward that the pace of single family production will accelerate approaching 1 million single family starts by the end of 2014. We expect multifamily starts to continue to increase but at a slower pace than the 200+ percent growth rate in the fourth quarter as starts move steadily toward the annual pace of 350 thousand that we consider sustainable.

blog housing starts 2013_03_1


One-Fourth of All Single-Family Homes are Built in a Strip from Delaware to Florida

July 23, 2012

Traditionally, the Census Bureau reports statistics on new residential construction (including housing starts) only for the four principal census regions: Northeast, Midwest, South and West.  The geography is limited by the way the sample for the Survey of Construction is drawn.  In 2009, the sample was redrawn in a way that allows for slightly more geographic detail (i.e., nine census divisions).  Although the added detail isn’t yet published on the Census website, it can be tabulated from a publicly available data set.

The public data set for residential construction in 2011 was released in June of this year.  It shows that more than one in four single-family starts occurred in the South Atlantic—a division that includes a strip of seven states on the east coast, stretching from Delaware to Florida—plus West Virginia and the District of Columbia.  Second is the West South Central Division (Arkansas, Louisiana, Oklahoma and Texas) with just over 20 percent.  Each of the other seven divisions accounted for less than 11 percent of single-family starts.

Since 2009, the South Atlantic increased its share of single-family starts from 23.1 to 25.7 percent, and the share also incresed in the Middle Atlantic (from 6.7 to 7.2 percent) and West North Central (6.7 to 7.3 percent).  The starts share in the other six divisions was either close to unchanged or down slightly from 2009, the last time NAHB published an article showing a division breakdown.

Historically, 2009 and 2011 were unusual in that fewer than 450,000 single-family homes were started in each of those years.  In comparison, from 1960 through 2007 single-family starts averaged about 1.1 million per year.  Caution is therefore required when interpreting recent statistics.  When such a large share of construction activity has disappeared, the current distribution of starts may be capturing a temporary effect (i.e., areas that were better able than others to resist the downturn) as well as longer-run geographic trends.


Housing Starts in April – A Positive Signal

May 16, 2012

New residential construction posted promising gains in April according to today’s joint release from the Census Bureau and Department of Housing and Urban Development. Preliminary estimates for housing starts show a seasonally adjusted annual rate of 717 thousand units, split between 492 thousand single family units and 225 thousand multifamily units, gains for both sectors. This is the sixth consecutive month with starts near or above 700 thousand.

There was some concern that the slower pace in March was an indication that a warm winter had pulled activity forward and the spring months could be weak as a result, but the strength of the April figures suggests momentum, rather than payback, will be the trend in coming months.

Building permit issuance did slow in April, but the decline was concentrated in the multifamily sector and brought April multifamily permitting more in line with the earlier trend.

Today’s starts numbers were consistent with yesterday’s release of the NAHB/Wells Fargo Housing Market Index (HMI) which showed improving builder sentiment. In particular, builders’ comments referred to increasing traffic in model homes, but also increasing commitment from buyers, in the form of deposits for sales.

This continuing upward trajectory in housing starts and builder sentiment suggests that consumers are regaining their confidence, and bodes well for a strengthening housing recovery.


Video: NAHB Chief Economist Reports on Housing Starts and Builder Confidence

April 18, 2012

February Housing Starts Pause

March 20, 2012

Single-family housing starts declined almost 10 percent in February from an elevated January due to abnormally warm weather country wide. February also has above average temperatures but not as off-normal as January. In addition, buyers are meeting the harsh realities of tight credit standards and poor appraisals that don’t account for the condition of the distressed sales used as comparables. The NAHB/Wells Fargo Housing Market index for March also showed a plateau for the same reasons. Home buyers are more plentiful and serious but continue to struggle with mortgage qualification barriers while builders compete with distress sales that keep prices soft.
The multifamily apartment construction sector continues to grow to an annual level of 241,000 and a three-month moving average above the 200,000 level for four consecutive months. Building permits were uniformly up across all building types and regions with the exceptions of a 2% decline in the South. The improvement in permits is a positive sign that builders still expect to see buyers in the spring and summer.
The three month moving average of total starts removes some of the monthly statistical and weather related deviations from trend and shows some leveling in the upward trend that began almost a year ago. As the economy and jobs continue to improve, the slowly rising trend set in mid-2011is expected to continue for a total starts level of 714,000 in 2012.