Existing Sales Surge

January 27, 2016

National Association of Realtors (NAR), Existing home sales, as reported by the National Association of Realtors (NAR), surged 14.7% in December, including an increase in the first-time buyer share to 32%, the highest share since August. December sales snapped back from a November decline partially attributable to delays in closings from the rollout of the Know Before You Owe mortgage disclosure rule by the Consumer Financial Protection Bureau (CFPB). The new rule was designed to help consumers understand their loan options and avoid closing cost surprises. Total existing home sales in December increased to a seasonally adjusted rate of 5.46 million units combined for single-family homes, townhomes, condominiums and co-ops, up from 4.76 million units in November. December existing sales were up 7.7% from the same period a year ago.

Existing Home Sales December 2015

Existing sales increased in all regions, ranging from 8.7% in the Northeast to 23.2% in the West. Year-over-year, all regions increased, ranging from 4.6% in the South to 11.9% in the Northeast.

Total housing inventory decreased by 12.3% in December, and is 3.8% lower than its level a year ago. At the current sales rate, the December unsold inventory represents a 3.9-month supply, down from a 5.1-month supply in November. Some 32% of homes sold in December were on the market for less than a month.

The distressed sales share decreased to 8% in December from 9% in November. Distressed sales are defined as foreclosures and short sales sold at deep discounts. The December all-cash sales share decreased to 24% from 27% in November and 26% in December 2014. Individual investors purchased a 15% share in December, down from 16% in November and 17% a year ago.

The December median sales price of $224,100 was 7.6% above last December, and represents the 46th consecutive month of year-over-year increase. The median condominium/co-op price of $209,900 in December was up 4.9% from last December.

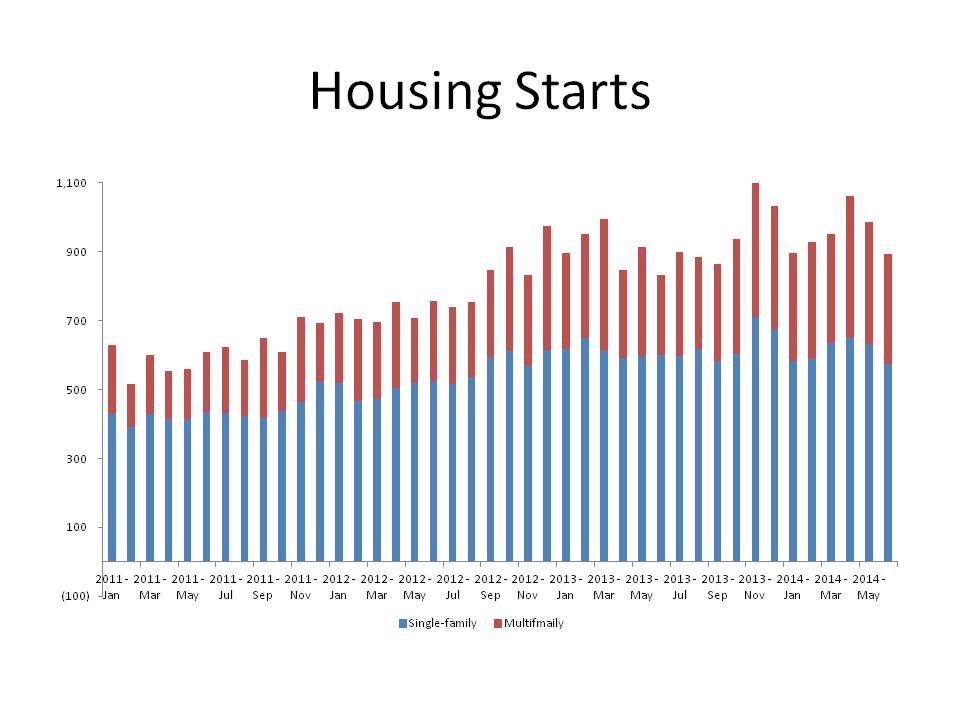
Although the Pending Home Sales Index fell slightly in November, the sharp volatility in November and December sales was a function of implementing a new regulation. Builder sentiment remains strong, and the tight inventory of existing homes bodes well for new single-family sales in 2016.


We’ve Moved…..

February 4, 2015

Please find Eye on Housing at its new location:

http://eyeonhousing.org/


FED Data Details Impact of New Mortgage Rules on Mortgage Approvals

August 5, 2014

The Federal Reserve Board recently released its survey of senior bank loan officers. The July 2014 Senior Loan Officer Opinion Survey on Bank Lending Practices (SLOOS) addressed changes in the standards and terms on, and demand for, bank loans to businesses and households over the second quarter of 2014.

In the July 2014 iteration of the Survey, the Federal Reserve Board included a set of special questions on the effects on the approval rates for home-purchase loans from the Ability-to-Repay and Qualified Mortgage Standards under the Truth in Lending Act (the ATR/QM rule), which came into effect early in 2014. The National Association of Home Builders has provided a comprehensive overview of the new rule. NAHB concluded from its analysis that some creditworthy borrowers could be denied access to affordable mortgages as a result of this rule’s implementation.

According to the results of the SLOOS, a fraction of banks reported that their approvals of mortgage purchase loans from individuals were likely lower because of the ATR/QM rule. However, as Chart 1 shows, the impact of the ATR/QM rule was disproportionately felt on approvals of prime non-conforming loans and on non-traditional loans relative to prime conforming loans; regardless of the credit score associated with the prime conforming loan application. As the Federal Reserve explains, “the majority of banks reported that the new rule has had no effect on the approval rate of prime conforming mortgages, in part because those loans qualify for a safe harbor under the exemption for loans that meet the underwriting criteria of the government-sponsored housing enterprises (GSEs)”.

Presentation1

However, while in the aggregate, the majority of banks reported that their approval of prime conforming mortgage loan applications were not impacted by the ATR/QM rule, a disproportionate share of other, smaller, banks were more likely to report a decline in approvals of these loan applications stemming from the ATR/QM rule. As the data below indicates, a plurality of smaller banks, 50%, reported that the ATR/QM rule likely lowered their approval of prime conforming loans for borrowers with a FICO score less than 680 and 44% reported that the ATR/QM rule likely lowered their approvals of prime conforming loans for borrowers with a FICO score greater than or equal to 680. This compares to 22% and 19% respectively for large banks. Moreover, the result that a majority of all banks reported that the ATR/QM rule likely lowered their approvals of prime non-conforming and non-traditional loans, as indicated in Chart 1, reflected the impact of the rule on the approvals of these mortgage applications by smaller banks, as shown in Chart 2.

Presentation2


Housing Construction Pauses

July 17, 2014

According to the Census Bureau and HUD, housing starts activity dipped 9.3% in June to an 893,000 seasonally-adjusted annual rate. The drop was concentrated in the South region where single-family starts fell 70,000, accounting for more than the total national drop of 57,000. Multifamily starts also fell 88,000 units in the South accounting for more than the 35,000 total drop for the US. The South was the only region with a fall in total starts.
Permits were also down 4.2% but the fall was concentrated in multifamily, which was down 15% and broadly felt in three of the four regions. Only the Midwest experienced an increase (4.6%) in multifamily permits. Even with this monthly drop, the three month moving average of multifamily permits remains near 400,000 and well above historic levels as most newly formed households are becoming renters.
Single-family permits were up 2.6% to 631,000 with three of the four regions reporting increases. Only the Northeast recorded a dip of 3.8% in single-family permits.
The unusual fall in construction activity in the South region extended to a 13.4% drop in single-family homes completed. The compilation of unique trends only in the South does not appear to be weather related or any regulatory changes that would cause builders to move construction to July.
The only remaining explanation is the continuing problems getting sufficient labor and lots for production. The faster moving markets in the energy belt, particularly Texas, are the most likely to see an even greater limit to production given the difficulty in competing in the labor pool against strong wage growth in the energy sector.
The dip in June single-family construction does not appear to be a general slowdown but rather an anomaly in June data that we expect to see corrected later this year as demand continues to pick up from pent up demographics.

Total Housing Starts


Green Building Features

July 2, 2014

A focus on energy efficiency is the most important development and design strategy that is making new housing greener according to a recent industry survey.

McGraw Hill Construction’s (MHC) data and analytics team surveyed a set of NAHB single-family and multifamily members in 2013. The survey found that 62% of single-family builders and 54% of multifamily developers are doing more than 15% of their projects as green. For single-family, 19% of builders are doing more than 90% projects as green.  The survey indicates that increasing consumer interest is a reason for growth in this area. MHC defines a green homes as “one that is either built to a recognized green building standard or an energy- and water-efficient home that also addresses indoor air quality and/or resource efficiency.”

green features

According to the report, 75% of single-family and 84% of multifamily builders indicated that improved energy efficiency was a factor making their projects more green than two years ago.

The second leading factor was improved indoor environmental quality. 58% of single-family builders and 55% of multifamily developers cited this as a reason why their current projects are more green.

Other leading factors include more water conserving products/practices and material conservation and recycling.

However, the data from the survey also show that only 11% single-family builders and remodelers are constructing homes that are greener in 2013 than in 2011. This result makes sense given the start and stop nature of the housing recovery and tight credit conditions of recent years.


Residential Construction Spending up 7.5% from One Year Ago

July 1, 2014

The latest Census estimate of total private residential construction spending is 7.5% higher than one year ago. In particular, the release shows significant improvement in construction spending for the single-family and multifamily categories. From May 2013, on a 3-month moving average basis, single-family construction spending increased by 12.3% and multifamily construction spending increased by 33.0%. The current seasonally adjusted annual rate for total private residential construction spending is $354.8 billion.

Chart_1

The current reading, however, is 1.5% lower than the revised April estimate. The three components of residential construction all fell in May. The home improvements category fell 1.9%, single-family spending fell 1.4%, and multifamily spending fell 0.6%.

The month-over-month decline in May should be considered along with the growth from last year.  If builder sentiment is a guide for future construction spending, cautious optimism is in order. The NAHB/Wells Fargo Housing Market Index for June rose four points to 49.


Housing Kicks into Gear

June 30, 2014

Pending home sales in May posted the largest monthly increase since the expiration of the first-time home buyer tax credit in April 2010. The Pending Home Sales Index (PHSI), a forward-looking indicator based on signed contracts reported by the National Association of Realtors (NAR), increased 6.1% in May to 103.9 from an upwardly revised April level of 97.9. It is important to note that the May reading was down 5.2% on a year-over-year basis.

Pending Home Sales May 2014

The May PHSI increased in all regions, ranging from 8.8% in the Northeast to 4.4% in the South. Year-over-year, however, only the Northeast posted a small increase of 0.2%. The three remaining regions all fell on a year-over-year basis ranging from a 2.9% decrease in the South to an 11.1% decrease in the West.

Last week, Census reported an 18.6% increase in May new home sales, and NAR reported a 4.9% increase in May existing home sales. The May increase in the PHSI suggests that the existing home market will continue to improve this summer as the market recovers from a disappointing winter period. The growth in household formations and strong pent-up demand will maintain that momentum throughout this year.


Is Everybody Happy?

June 27, 2014

Consumers have been regaining confidence and feeling better about the jobs market. For instance, the Conference Board’s Consumer Confidence Index rose to a six-and-a-half year high in June. Moreover, their expectations for the next six months improved to a 10-month high. The Thomson Reuters/University Consumer Sentiment Index ticked up as well in June, but not at record levels.

In addition, the ongoing recovery in the labor market has made people feel more comfortable about the job market. As the figure below shows, the share who thought jobs were plentiful has been trending up starting in 2010 to 14.7 percent in June which is the most seen since May 2008. (Although, almost 54 percent of consumers in June still feel jobs are scarce.)

June Confidence

One downside to the Consumer Confidence report is that people under the age of 35, otherwise known as “Millennials,” lost confidence in the economy in June. They represented 28% (65.6 million) of the population 20 years and older in 2013 with the largest 5-year cohort among all ages at 20 to 24 (22.8 million), according to recently-released estimates by the Census Bureau. Their unemployment rates were 8.1% and 11.1%, respectively, as of May this year. This helps explain why households under 35 have a homeownership rate of only 36.2% in the first quarter of 2014 and they just may be those that feel jobs are scarce.


Contract Rate on New Home Loans Dips Under 4 Percent

June 26, 2014

On average, mortgage interest rates declined in May, according to data released earlier today by the Federal Housing Finance Agency (FHFA).  On conventional mortgages used to purchase newly-built homes, the average contract interest rate dropped by more than 30 basis points, from 4.19 to 3.88 percent.  This is the lowest the new home loan rate has been in a year and the first time it has dipped below 4.0 percent since February.

Contr Rate May 14

Initial fees increased slightly during the month, from 1.22 to 1.25 percent—far from enough to offset the decline in the contract rate.  The result was an average effective rate on new home loans (which amortizes initial fees over the estimated life of the loan) that also dropped by more than 30 basis points, staying barely above 4.0 percent (at 4.01).

Eff Rate May 14

Reversing the trend of the prior two months, the average size of conventional mortgages used to purchase new homes—and the price of the new homes purchased with the mortgages—both declined in May.  The average loan size declined 1.8 percent to $319,800, while the average home price fell by 3.6 percent to $418,800.  Despite the declines, both the average loan size and average new home price remain higher than they had been at any time prior to 2014.

Because the change in price was greater than the change in loan size, the average loan-to-price ratio on conventional mortgages used to purchase new homes increased substantially in May, from 77.0 to 78.6 percent—the highest it’s been since last August, and the first time above 78.0 percent in 2014.

LTP May 14

This information is based on FHFA’s Monthly Interest Rate Survey (MIRS) of loans closed during the last five working days in May. For other details about the survey, see the technical note at the end of FHFA’s June 26 news release.


Housing’s Other Contribution to GDP

June 26, 2014

Housing added 0.7 percentage points to real GDP growth in the first quarter of 2014, however the construction component (residential fixed investment) detracted from growth over the past two quarters owing to the poor weather conditions seen across the country over the period. In addition, housing accounted for 15.6 percent of total real GDP, which is low from a historical perspective.

 
The price component of GDP is becoming more interesting, however. Starting in 2012, housing has been contributing more to prices, for the most part, as seen in the figure below. In the first quarter of this year, it added over 0.7 percentage points to growth in the GDP price index, led by nearly 0.5 percentage points in the construction component (the most since the third quarter of 2008); the overall price index rose 1.3 percent. This is partly due to increased construction costs and higher rental prices.

GDP Price

Currently, overall inflation remains subdued and is within the Federal Reserve’s comfort zone. But moving forward, if housing becomes an even larger share of GDP, it would likely place upward pressure on inflation measures in general.