Profile of NAHB’s Builder Members

June 9, 2014

NAHB conducts an annual census of its builder and associate members in order to better understand the composition and characteristics of its membership. The census collects company as well as demographic information. This blog entry summarizes findings from the 2013 Builder member census, with a more extensive article available here. A later entry will summarize findings from the 2013 Associate member census.

Over half of NAHB’s builder members in 2013 were single-family builders (58%), and about a quarter were residential remodelers (24%). Far smaller shares were involved with multifamily building or commercial remodeling (5% each), and commercial building or land development (4% each). Less than half of 1% were manufacturers of modular/panelized/log homes.

Builder Primary Activity


About half of builder members had 4 or fewer employees in 2013 (54%). The median number of employees was 4 and the average 11. Only 3 percent of builder members reported having 50 employees or more.

Employees


In 2013, builders started an average of 43 units (up from 30 units in 2012), while the median number of units started rose to 5 (from 4 in 2012). The majority (60%) of builders started between 1 and 10 units, while only 8% started 100 units or more. Median revenue among builder members rose to $1.8 million in 2013, a 65% increase compared to 2012.   From 2008 to 2011, builders’ median revenue remained largely unchanged at around $900,000.

The median builder is 56 years old; the vast majority are male (93%), White (97%), and non-Hispanic/Latino (98%).


Apartment and Condominium Market Shows Positive Growth in First Quarter

May 29, 2014

The NAHB Multifamily Production Index (MPI) increased three points to 53 in the first quarter of 2014, which is the ninth consecutive quarter with a reading of 50 or above.

The MPI measures builder and developer sentiment about current conditions in the apartment and condominium market on a scale of 0 to 100. The index and all of its components are scaled so that any number over 50 indicates that more respondents report conditions are improving than report conditions are getting worse.

Ex1

The MPI provides a composite measure of three key elements of the multifamily housing market: construction of low-rent units, market-rate rental units and “for-sale” units, or condominiums. The MPI component tracking builder and developer perceptions of low-rent units increased one point to 48 and for-sale units jumped eight points to 54. Meanwhile, the index tracking market-rate rental properties slipped one point to 59, but has remained consistently above 50 since the fourth quarter of 2010.

The MPI shows stable production of apartment units in 2014, which is in line with NAHB’s expectation of a 6 percent increase in multifamily starts this year.

The Multifamily Vacancy Index (MVI), which measures the multifamily housing industry’s perception of vacancies, dropped one point to 37. With the MVI, lower numbers indicate fewer vacancies. The MVI improved consistently through 2010 and has been at a fairly moderate level since 2011 after peaking at 70 in the second quarter of 2009.

Ex2

Historically, the MPI and MVI have performed well as leading indicators of U.S. Census figures for multifamily starts and vacancy rates, providing information on likely movement in the Census figures one to three quarters in advance.


What Home Buyers Really Want: Ethnic Preferences (Part IV)

April 3, 2014

Previous posts highlighting findings from the study What Home Buyers Really Want: Ethnic Preferences have shown how housing preferences may – or may not – be affected by the racial background of the home buyer. One aspect of the home where race/ethnicity does not play a significant role is energy efficiency – a top priority across the board for all groups analyzed.

Data in the graph below show that buyers of all backgrounds will not really be moved to pay more money for a home simply to help the environment in some broad and vague sense: over 65 percent of all groups report wanting an “environment-friendly” home, but are not willing to pay more for it. Only small minorities of 15 percent or less would actually pay more just to be friendly to the environment.

Fig1

However, when the question is phrased more specifically in terms of energy efficiency, and the impact that such features can have on utility bills, home buyers show they care a lot. When faced with a trade-off choice between having a highly energy efficient home with lower utility bills over the life of the home vs. one without those features that costs 2% to 3% less, over 80 percent of buyers of all backgrounds prefer the more expensive home that includes the energy saving features.

Fig2

Further evidence of this strong desire for energy efficiency is found in the graph below.  Home buyers were asked how important a consideration it would be to have low utility costs when choosing their next home.  Strong majorities of White, African-American, Hispanic, and Asians buyers (over 80 percent) agree that low utility costs will be important to very important when making that decision.

Fig3

Knowing that buyers are willing to pay for energy efficiency features so long as that translates into lower utility bills leads to the question of how much more are buyers willing to pay, beyond the original price of the home, in order to save say $1,000 a year in utility costs?  The answer is an average of $6,774 among White buyers, $7,578 among African-American buyers, $9,146 among Hispanic buyers, and $8,251 among Asian buyers.  The latter amounts suggest buyers expect fairly steep rates of return for the money they invest in energy efficiency – somewhere between 10.9 percent and 14.8 percent.

Fig4


What Home Buyers Really Want: Ethnic Preferences (Part III)

March 28, 2014

Previous posts highlighting findings from the study What Home Buyers Really Want: Ethnic Preferences have shown that a buyer’s race or ethnicity can play a role in how he/she evaluates the characteristics and features of a prospective home. The analysis was focused on four racial/ethnic groups of home buyers:

  • White (Non-Hispanic),
  • African-American (non-Hispanic),
  • Hispanic, and
  • Asian.

Based on a list of almost 30 kitchen features that buyers got to rate as essential, desirable, indifferent, or ‘do not want’, the table below shows the 10 ‘most wanted’ kitchen features for each of the four racial/ethnic groups. Interestingly, the features that make it on this ‘most wanted’ kitchen list are identical across the four groups, albeit in different order. In fact, the top three are exactly the same among all groups (in slightly different order):

  • Table space for eating
  • Walk-in pantry
  • Double sink

Other features that appear in all four groups’ ‘most wanted’ kitchen lists include a central island, granite countertops, recessed lighting and a desk/computer area.

Fig1


A similar list of the top 5 ‘most wanted’ bathroom features (out of more than 15 such features buyers were asked to rate) shows that 4 of these 5 are also common across all racial/ethnic backgrounds:

  • Exhaust fan
  • Linen closet
  • Both a shower stall and a tub in master bathroom
  • Double vanity

Fig2


When it comes to technology, the one feature that White, African-American, Hispanic, and Asian buyers alike most would like to have in their next home is a wireless home security system, ranked most wanted by all four groups out of more than 20 technology features listed. This result suggests that including a security system may be a strong selling point across all backgrounds.   In addition to the wireless home security system, three other features appear on the top 5 ‘most wanted’ tech list of all four groups:

  • Programmable thermostat
  • Security cameras
  • Wireless home audio system


Fig3


The next and final post on this series based on the study What Home Buyers Really Want: Ethnic Preferences will report on buyers’ attitudes toward the environment and their willingness to pay more for a home that saves them $1,000 a year in utility costs.


What Home Buyers Really Want: Ethnic Preferences (Part II)

March 18, 2014

Findings from the latest NAHB study on housing preferences, What Home Buyers Really Want: Ethnic Preferences, show there are both similarities and differences in what home buyers of different racial/ethnic backgrounds most want to have in their homes.

Based on an extensive list of more than 120 home and community features that buyers rated as essential, desirable, indifferent, or ‘do not want’, the table below shows the top 10 most wanted features for White, African-American, Hispanic, and Asian buyers.

Highlighted in yellow are the four features that are common to all four lists, i.e., they are really wanted by buyers of all racial/ethnic backgrounds:

  • A laundry room – the single-most wanted feature for all groups, except Asians who rank it 5th most wanted.
  • Energy-star rated appliances
  • Energy-star rating for the whole home
  • Exterior lighting

Highlighted in green are three features that are relatively more important to minority buyers than to White buyers, since they appear on the top 10 list for the minority groups but not for White buyers:

  • Living room
  • Dining room
  • Patio

Finally, highlighted in blue, are the two features that make it into White buyers’ top 10 most wanted list, but are ranked lower by the three minority groups:

  • Garage storage
  • Insulation higher than required by code

Fig1

When building homes, it is as critical to understand which features home buyers really want, as it is to know which ones they do not want and will probably not pay for.  The table below shows the 10 most ‘unwanted’ features (out of the 120+ home and community features listed) for each of the racial/ethnic groups analyzed in the study.

Interestingly, there are quite a few similarities in what home buyers reject across the different groups: 7 of the 10 most unwanted features are common across the four rejection lists (highlighted in yellow):

  • An elevator – the single-most unwanted feature across all four groups
  • Golf course community – second most unwanted feature across the board
  • High density community
  • Only a shower stall in the master bath (no tub)
  • Gated community (with a monthly fee of $100 to $200)
  • Wine cooler
  • Wet bar

Other features on this table, such as laminate countertops in the kitchen and a two-story family room, are among the 10 most unwanted features of three out of the four racial/ethnic groups analyzed.

Fig2

The next post on this series based on the study What Home Buyers Really Want: Ethnic Preferences will cover the specific kitchen, bathroom, and technology features most wanted by buyers of different racial/ethnic backgrounds.


What Home Buyers Really Want: Ethnic Preferences (Part I)

March 10, 2014

Among other demographic variables, such as age, income, or stage of life, a buyer’s race or ethnicity can play a significant role in how he/she evaluates the characteristics and features of a prospective home.  A new study recently released by NAHB, What Home Buyers Really Want: Ethnic Preferences, was designed to compare and contrast how housing preferences are affected– or not –by the racial/ethnic background of the home buyer, after controlling for factors such as age and income.  The analysis focused on four racial/ethnic groups of buyers:

  • White (Non-Hispanic),
  • African-American (non-Hispanic),
  • Hispanic, and
  • Asian.

Survey results corroborate well-known demographic differences between these groups:

  • Minority home buyers are younger than White (non-Hispanic) buyers: the median African-American buyer is 39 years old, the median Hispanic buyer is 37, and the median Asian buyer is 36. The median White buyer is 43 years old.
  • Asian home buyers have the highest median household income of all four groups, $72,797, compared with $67,747 for Whites, $50,221 for Hispanics, and $43,774 for African-Americans.  Asians also expect to pay the most for their next home: $283,469, compared with $205,775 among Whites, $181,444 among Hispanics, and $176,397 among African-Americans.

Fig1So what are some of the differences/similarities among these groups in terms of housing preferences?  After controlling for age, income, and household type, survey findings show that Hispanics and African-Americans want more bedrooms.  In fact, 51 percent of Hispanics and 49 percent of African-Americans report wanting to have at least 4 bedrooms in their home, compared to 44 percent among Asians and 36 percent among White buyers.

Fig2A majority of buyers in all four racial/ethnic groups, however, will be satisfied with up to 2½ baths: 73 percent of Asians, 65 percent of both White and Hispanic buyers, and 61 percent of African-Americans.  Similarly, most buyers in all four groups prefer high ceilings (9 feet or more) in the first floor of their home: 75 percent of Asians, 68 percent of African-Americans, 67 percent of Hispanics, and 64 percent of White buyers.

Fig3

Fig4

Placing the washer and dryer in the first floor of the home is a good bet, as buyers of all backgrounds strongly prefer this location for the laundry equipment: 76 percent of Whites, 51 percent of African-Americans, 50 percent of Hispanics, and 46 percent of Asians.  The basement and garage are the second and third choice for about 20 percent of both Hispanics and Asians, significantly more than the share of White buyers who want to do laundry in either of these locations.

Fig5The 2-car garage is the most popular parking facility across all groups, preferred by more than 50 percent of White, African-American, and Asian buyers as well as 47 percent of Hispanic buyers.  A garage for 3 cars or more has far fewer fans, especially among minorities.

Fig6This blog post is the first in a series that will release findings from What Home Buyers Really Want: Ethnic Preferences, covering topics such as the specific home and community features most wanted by buyers of different racial/ethnic backgrounds.


Features Most Likely to Show up in Typical Single-family Home in 2014

March 4, 2014

Knowing what your competition is up to is a must in any industry.  In residential construction, that includes having a clear picture of what other builders are putting in their new homes.  In December 2013, a nationwide survey asked builders about the likelihood that a number of features would be included in the typical single-family home they will build this year.

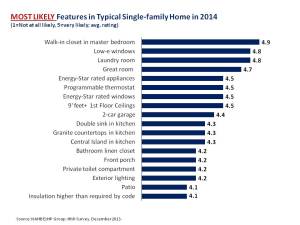
Based on ratings from 1 to 5, where 1=not at all likely and 5= very likely, builders reported the following as the most likely features to show up in the typical 2014 home:

  • Walk-in closet in master bedroom
  • Low-e windows
  • Laundry room
  • Great room

Also likely are a number of energy efficiency features:  Energy-star rated appliances and windows, a programmable thermostat, and insulation higher than required by code.  In the kitchen, a double sink, granite countertops, and a central island are highly likely to make the cut.  A few outdoor features are likely candidates as well: a front porch, outdoor lighting, and a patio.

fig1

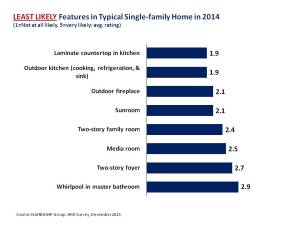
In contrast, the two least likely features builders will include in their new homes this year are:

  • Laminate countertops in the kitchen
  • Outdoor kitchen (cooking, refrigeration, & sink)

Two-story spaces (family room and foyer) also seem to be unlikely features, as well as an outdoor fireplace, a sunroom, a media room, and a whirlpool in the master bathroom.

fig2


Homes Under Construction Rises for 28th Straight Month

January 20, 2014

Although housing starts may have declined slightly in December, they remain at roughly (a seasonally adjusted annual rate of) 1 million units.  Not only is this relatively strong compared to the recent history, it means that new homes are feeding into the beginning of the production pipeline faster than they’re leaving at the other end (as completions have fluctuated within a fairly broad but lower band of roughly 700,000 to 830,000).

As a result, the number of new homes under construction increased for the 28th consecutive month in December, from a seasonally adjusted 688,000 to 707,000—breaking above the 700,000 barrier for first time since March of 2009.

UC-Recent-Dec13

As reported last month, the growth continues to come from both single-family and multifamily construction.  In December, the number of single-family homes being built increased for the 23rd time in the 24 months—from 331,000 to 339,000.  Meanwhile, the number of apartments under construction increased for the 32nd time in 33 months—from 357,000 to 368,000.

One of the reasons the rate of completions is lagging starts and causing the number of homes under construction to swell is that, after a prolonged downturn, it’s difficult to attract factors of production back into the market.  Over the past year, shortages have popped up in the markets for certain building materials, developed lots, and skilled labor.  A current example is the high share of unfilled job openings in the construction sector reported by the Bureau of Labor Statistics.


Homes Under Construction: A Good Sign of Recovery

December 18, 2013

Although reports on the Census Bureau’s New Residential Construction release usually emphasize housing starts (and may mention permits), the number of homes under construction is also worth looking at, and at this time is a particularly good indicator of sustained recovery in the home building industry.

The Census Bureau’s latest release shows that the seasonally adjusted number of homes under construction has now increased for 27 months in a row, going from 413,000 in August of 2011 to (a preliminary estimate of) 685,000 in November of 2013.

UC-Recent

The increases have come from both single-family and multifamily construction.  The number of single-family homes being built rebounded in November after dipping slightly in October—but prior to that had increased for 21 straight months, with the changes taking us from 236,000 in December of 2011 to 329,000 in November of 2013.   Meanwhile, the number of apartments under construction was flat in July of 2012, but otherwise increased every month from August 2011 to November 2013, going from 174,000 to 356,000 over that span.

During relatively stable periods, there’s a rough balance between starts and completions, and the number homes being built is likely to fluctuate in either direction.  But during a strong sustained trend, the normal balance may be disrupted as the time it takes to build a home speeds up or slows down and the numbers of housing units moving into and out of the pipeline at either end diverge.  In times like that, movement in the number of units under-construction can be very persistent.

During the latest housing downturn, for instance, the number of homes under construction declined every month for over four straight years, with the declines continuing well after it appeared starts had bottomed out.  Now, the “under construction” series is providing some of the most consistent evidence of the industry’s ongoing recovery.

UC-Long Term

The number of homes under construction is also of interest, because it’s the most direct determinant of the demand for labor.  NAHB has estimated that, nationally, building an average single-family home requires enough labor to keep 3.05 people employed full-time for a year (including the upstream effects of jobs in manufacturing and product distribution), and an average rental apartment requires enough to employ 1.16.


How Long Does It Take to Build a House?

October 21, 2013

The 2012 Survey of Construction (SOC) from the Census Bureau shows that on average it takes about 7 months from obtaining a building permit to completing a new single-family home. Looking at the houses completed in 2012, houses built for sale, on average, register the shortest time from permits to completion – between 5 and 6 months. Houses built on owner’s land take longer – about 8 months if built by a contractor and more than 11 months if they are owner-built (i.e., where the owner of the land serves as a general contractor). Single-family homes built for rent take, on average, between 8 and 9 months from permits to completion.

In most cases, no time is wasted from the moment a permit is obtained and construction is started. Most homes built for sale and on owners’ land are started prior or within the same month as authorization. Houses built for rent, on average, register a slight delay of one month before construction is started.

The time from permits to completion varies across the nine Census divisions. New England and Middle Atlantic register longer times of between 9 and 10 months. Pacific and East North Central division also show above average time of 8 months to completion. Builders in the East South Central Division manage to complete a home in 7 months, on average. The rest of the country registers times between 5 and 6 months.

time_to_build

For houses built for sale, the SOC also gathers information on sales, registered at the time when a buyer signs a sale agreement or makes a deposit on the home, not the final closing. For new single-family homes sold in 2012, the average time from completion to sale is under one month. However, this average is highly skewed by a relatively small number of homes that are not sold prior or while under construction. Looking at new single-family homes completed in 2012, more than three quarters of these properties were sold before or during the completion month, including 30 percent that were pre-sold (i.e., sold before being started).  Only 6 percent of homes completed in 2012 remain unsold as of the first quarter of 2013. So, for most new single family homes there is no additional lag from completion to sale.