Green Building Features

July 2, 2014

A focus on energy efficiency is the most important development and design strategy that is making new housing greener according to a recent industry survey.

McGraw Hill Construction’s (MHC) data and analytics team surveyed a set of NAHB single-family and multifamily members in 2013. The survey found that 62% of single-family builders and 54% of multifamily developers are doing more than 15% of their projects as green. For single-family, 19% of builders are doing more than 90% projects as green.  The survey indicates that increasing consumer interest is a reason for growth in this area. MHC defines a green homes as “one that is either built to a recognized green building standard or an energy- and water-efficient home that also addresses indoor air quality and/or resource efficiency.”

green features

According to the report, 75% of single-family and 84% of multifamily builders indicated that improved energy efficiency was a factor making their projects more green than two years ago.

The second leading factor was improved indoor environmental quality. 58% of single-family builders and 55% of multifamily developers cited this as a reason why their current projects are more green.

Other leading factors include more water conserving products/practices and material conservation and recycling.

However, the data from the survey also show that only 11% single-family builders and remodelers are constructing homes that are greener in 2013 than in 2011. This result makes sense given the start and stop nature of the housing recovery and tight credit conditions of recent years.


Energy Tax Credits: Large Impacts After 2010 Rule Changes

March 21, 2014

In 2005, Congress established a number of energy-efficiency tax incentives related to housing. These policies include the tax code section 45L credit for the construction of energy-efficient homes, the 25C credit for retrofitting existing homes, and the 25D credit for the installation of power production property in new and existing homes.

Using earlier IRS data for tax year 2009, we previously examined who benefitted from the 25C and 25D credits, as well as how homeowners used the credits. Last year, we examined the 2010 data for these credits.

With the publication of the tax year 2011 IRS data for 25C and 25D, significant reductions in use are clearly seen due to the rule changes that occurred at the end of 2010.

For example, from 2009 through the end of 2010, the 25C credit for existing homes was available as a 30% credit and $1,500 limit. After the extension of the “tax extenders” legislation at the end of 2010, those rules were pared back and retained when the credit was extended again as part of the Fiscal Cliff deal. Among those rule changes, the credit was reduced to a 10% rate and a $500 lifetime cap was imposed. It is worth noting that this version of the credit, along with many other tax extenders, expired at the end of 2013.

25C_2011

The 2011 IRS data show significant declines in 25C use as a result of the 2010 changes. The largest impact came from energy-efficient windows, for which the total dollar volume of installed qualified property fell from about $7.8 billion to approximately $1.4 billion. Qualified furnace installations declined by more than $5 billion, reaching a 2011 total of about $180 million.

Tax credit qualified insulation installations fell by more than $1.5 billion but was the largest category in 2011 at a total of $1.87 billion. Roofing retrofits were second with a tally of $1.4 billion.

In total, more than $6 billion of qualified improvements were made in 2011 in connection with the 25C credit. These expenditures resulted in more than $750 million in tax credits for just shy of 3.5 million homeowners.

25D_2011


In contrast, tax credit use under section 25D of the code expanded in 2011 from 2010 levels. The 25D credit is for installation of qualified power production property in both new and existing homes. The credit is equal to 30% of expenditures, including certain labor costs and is claimed by the homeowner. Unlike the 25C credit, the 25D program remains in law and is scheduled to sunset at the end of 2016.

The most popular 25D investment in 2011 was the installation of residential solar panels. 25D qualified solar electric property investments totaled almost $1.5 billion in 2011 for more than 100,000 taxpayers. It is worth noting that these solar installations reflect credits claimed for electrical system integrated panels that provide power for the home, as well as panels used to power stand-alone property like attic fans.

The second largest category was geothermal heat pumps, with $1.2 billion of installations claimed by more than 70,000 homeowners. The geothermal category experienced the largest growth in 2011 in terms of tax credit claims, up almost $300 million in total installations over 2010 totals.

In total, for 2011 there were $3.03 billion of qualified power production investments yielding about $921 million in 25D credits.

Given the rising popularity of items like solar panels, builders are well advised to examine the 25D program for prospective homeowners. The 25D credit can be awarded in new construction by providing the eventual homeowner an itemized breakout of material and labor costs associated with qualified property installation, so that the homeowner can claim the credit on their income tax return. An IRS Q&A on 25D and 25C can be found here.


NAHB Survey on Installation of Energy Producing Equipment and Green Building

February 14, 2014

Survey data of single-family builders collected by NAHB at the end of 2013 reveal the share of builders who installed energy producing equipment in new construction, highlighting an important trend in home building.

The November 2013 data finds that 23% of surveyed builders installed alternative energy producing equipment in the past year. Of those answering “yes”:

  • 82% installed geothermal heat pumps
  • 26% had installed photovoltaic solar panels

These are two types of property that provide a 30% federal tax credit (under tax code section 25D). Unlike the 25C credit (for windows, doors, and other energy-efficient property), which is only available for existing principal residences, the 25D credit is available for new and existing homes, and primary and secondary residences (except for fuel cells, which can only be claimed in connection with a principal residence). Like the 25C program, the tax credit is claimed by the homeowner/homebuyer.

The 25D credit is scheduled to remain in law until the end of 2016. The 25C credit expired at the end of 2013, although it may be extended along with other “tax extenders,” later in 2014.

Another trend the NAHB survey revealed is that even for new homes not possessing solar panels and other power production equipment, design choices are being made to enable future installation. Of those 77% of builders who answered “no” to the question of power production property installation, an additional 23% (nearly 18% of the survey total) built infrastructure that would allow the homeowner to install the power producing equipment easily in the future (e.g. conduits for wiring the electric system to solar panels).

The combination of currently installed property and infrastructure accommodation for future installation suggests a trend in builder practices that will allow homes to produce some, or all, of their own power. However, it is important to keep in mind that mandates associated with these practices should be avoided because such installations will not be cost-effective or match consumer preferences in all markets and for all homes.

The survey also revealed which green building products or practices are most common among builders. Leading the list were:

  • low-e windows (91%)
  • high-efficiency HVAC systems (90%)
  • programmable thermostats (86%)
  • ENERGY STAR appliances (79%)
  • duct systems designed to minimize inefficiencies (74%)

Senate Finance Staff Discussion Draft: Energy Tax Incentives

December 23, 2013

Last week saw the release of yet another discussion draft from the staff of the Senate Finance Committee concerning tax reform. Following draft proposals concerning depreciation/accounting and other business expenses (such as advertising), the most recent draft proposes changes to the tax code’s rules concerning energy production and energy-efficient improvements.

Under the draft proposal, most existing energy tax incentives would be eliminated or otherwise allowed to sunset and replaced by two credits.

The first would be a tax credit for the production of clean energy, with the value of the credit determined by the amount of greenhouse gases produced during production – greener production, more credit. The credit could be claimed either as an energy production credit or an investment credit of up to 20% based on installed qualified equipment. The credit would become effective for new power production facilities after January 1, 2017, although after 2016 a 20% credit would be available for existing facilities that retrofit to capture at least 50% of carbon dioxide emissions. The credit would phase out when U.S. electricity production emits 25% less in greenhouse emissions.

The second credit would reward the production of any transportation fuel that is 25% cleaner than conventional gasoline. The maximum credit would be $1 per gallon, with the actual credit determined for the fuel relative to gasoline. The credit would begin in 2017. Alternatively, an investment credit would be available based on 20% of the value new, qualified production facilities.

In turn, the draft proposal would eliminate or phase out almost all existing energy tax incentives. For housing, this means:

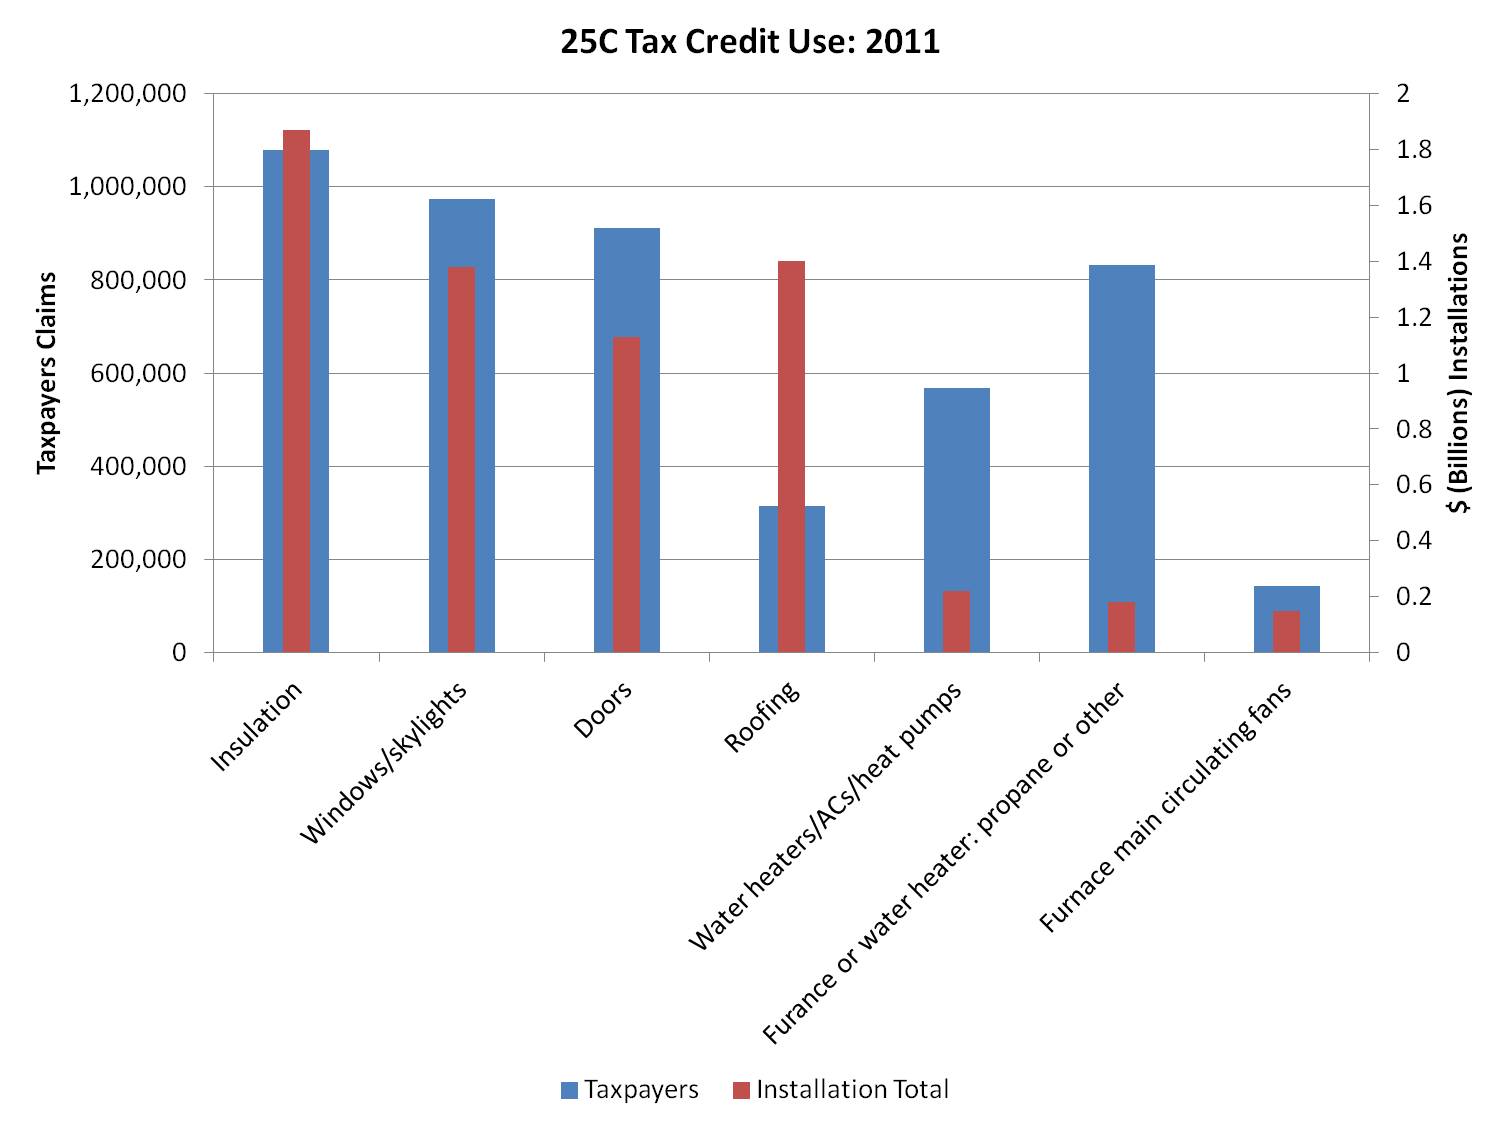
  • The section 25C tax credit for energy-efficient improvements to existing homes would sunset permanently at the end of 2013
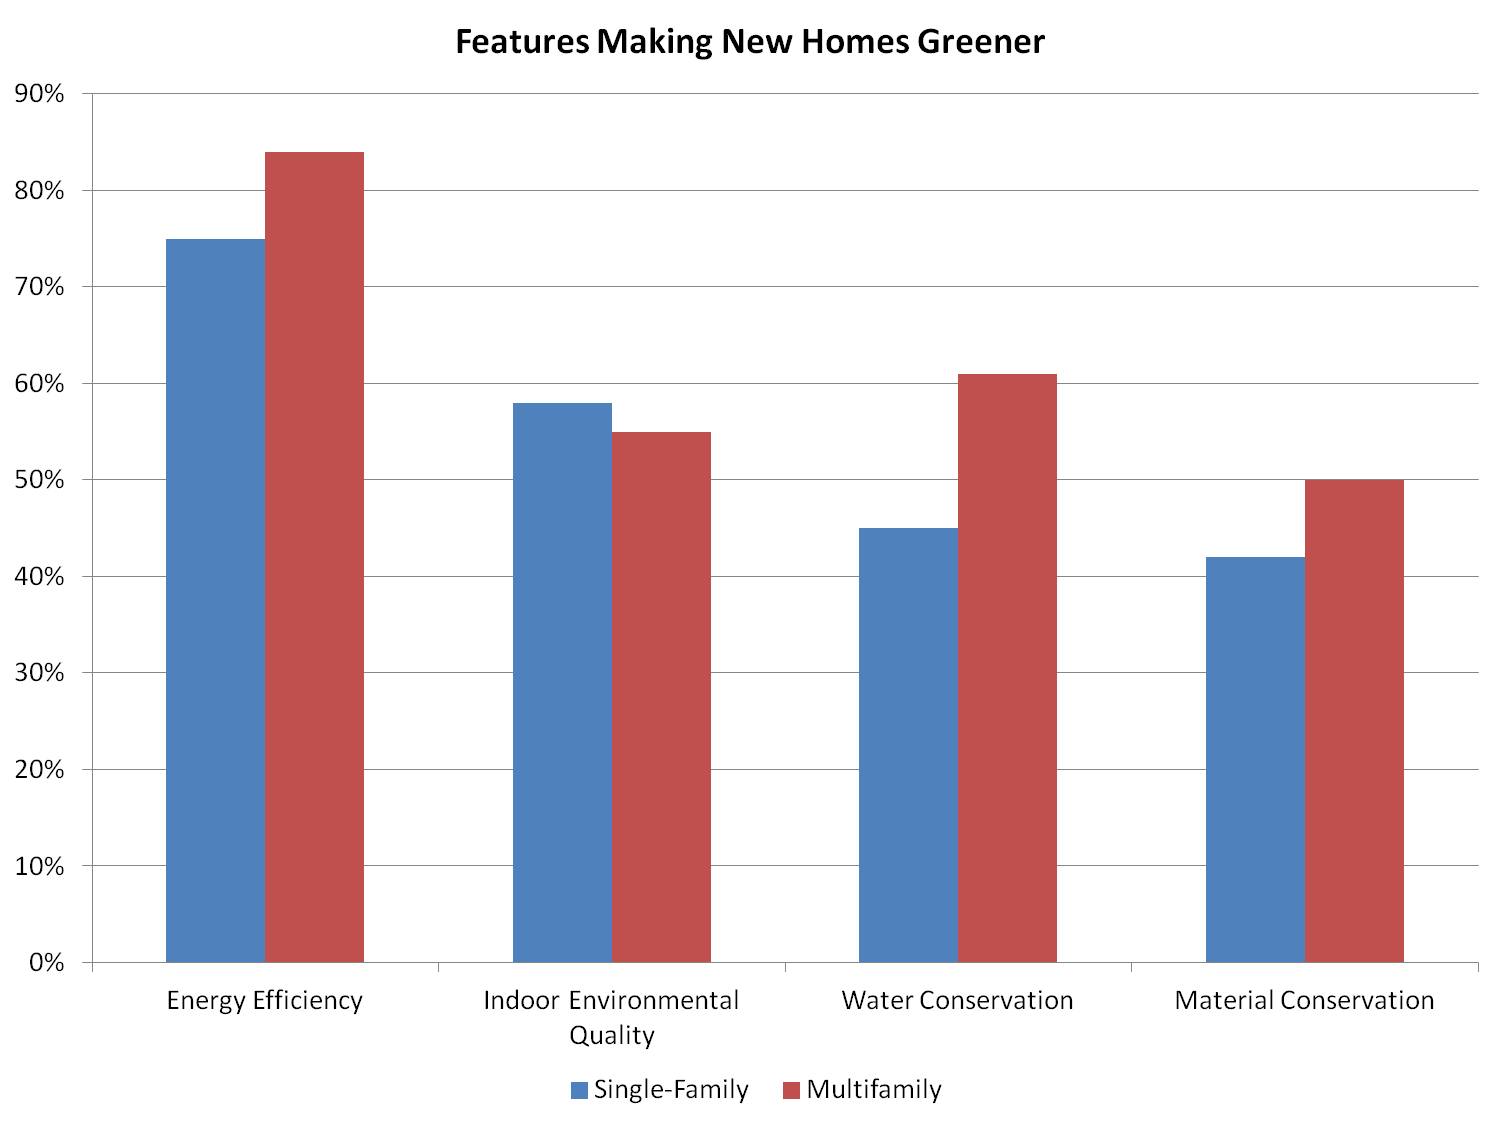
  • The section 45L $2000 tax credit for the construction of new energy-efficient homes would sunset permanently at the end of 2013
  • The section 179D credit for commercial and multifamily energy-efficient improvements, as proposed in the cost recovery draft, would be eliminated

The section 25D 30% tax credit for residential solar, geothermal, wind turbines, and fuel cells would remain under present law, but the December 31, 2016 sunset would be enforced.

It is estimated that these changes on net could raise $75 billion in tax revenue over ten years.

A number of general principles are embodied in this proposal, with negative consequences for housing and real estate measured against present policy.

First, the proposed approach would clearly favor energy production over energy conservation and retrofitting. Improving existing buildings, or constructing energy-efficient properties with long-run benefits for potential future owners, is an approach that is rewarded under the existing tax credit system.

Second, the proposed tax benefits for energy production appear to exclude homeowners and perhaps some rental housing and commercial real estate owners. The proposed legislative drafts indicate that for a taxpayer to qualify for the investment credit (as homeowners can do now under the 25D credit), the installed property must be eligible for depreciation. Homeowners do not claim depreciation deductions, so it appears power produced by an owner-occupied home would not be eligible. Furthermore, to qualify for the first tax credit noted above, any electricity produced on site must be sold to either an unrelated party or metered and monitored by a third-party. This rule may exclude some apartment and commercial real estate owners from the proposed tax rule for on site power production.

If this preliminary analysis is correct, excluding on-site power production is a policy mistake given such production does not suffer from transmission losses. According to the Department of Energy’s Energy Information Administration (EIA), “annual electricity transmission and distribution losses average about 7% of the electricity that is transmitted in the United States.”

NAHB will continue to review the proposal, which could be included in future comprehensive tax reform proposals, and submit comments to the Senate Finance Committee in January. In meantime, discussion is beginning to pick up concerning energy tax extender items, including the section 25C and 45L credits, which expire at the end of 2013.


Energy Efficiency Should Yield 10 Percent-Plus Return, Study Says

June 28, 2013

A study published in June  presents evidence in support of NAHB’s policy, which classifies a change in building codes as cost effective if it returns at least 10 percent in energy savings the first year.

The study argues that a common alternative to NAHB’s policy, using the current mortgage rate to evaluate energy efficiency, is an unrealistic assumption and produces unrealistic results.  In particular, taking the mortgage rate to be representative of the rate of return home buyers require fails to capture borrowing constraints and doesn’t reflect the way buyers actually evaluate alternatives when deciding on which features to include in a new house.

The study presents evidence from three different sources indicating that the rate of return that drives most home buyer decisions is much higher (summarized in the chart below).

Avg Rates in Housing

Notice that the 10 percent return in NAHB’s policy is slightly below the rates from these three sources, but is at least in the general neighborhood.  The current mortgage rate, on the other hand, is far too low at under 4 percent.  Using a rate this low to evaluate savings on utility bills will classify as cost effective some features that are clearly priced higher than the market will bear.

This doesn’t mean that home buyers are apathetic about energy efficiency or are unwilling to pay for it.  NAHB’s latest consumer survey provides clear evidence that home buyers care about energy efficiency and are willing to pay for it.  But there are limits on how much they will pay up front relative to the annual savings they can expect.

The study also shows that rates of return should be higher at the affordable end of the housing spectrum—where first-time buyers and buyers with modest incomes are likely to be living paycheck to paycheck and therefore need a higher return in exchange for an immediate sacrifice.  Further details, including documentation of data sources, are available in the full study.


Occupants Say Newer Homes are Better Insulated, Less Drafty

August 21, 2012

The Residential Energy Consumption Survey (RECS, produced by the Energy Information Agency in the U.S. Department of Energy) collects information on various housing characteristics, including the age of the structures.   Although the actual energy consumption data has not yet been released, a RECS data set containing a considerable amount of ancillary, related information is available.  For example, answers are available to a subjective RECS question asking occupants if their homes are “well,” “adequately” or “poorly” insulated (homes with no insulation at all are a separate, but rarely checked category).

Tabulating the results shows that, overall, 38.6 percent of households in single-family detached homes judge their homes to be well insulated.  However, as you might expect, the results vary depending on how old the homes are.  Among occupants of single-family detached homes built before 1960, the well-insulated share is under 30 percent.  After that, the share increases regularly as the homes get newer until it reaches 67 percent for homes built after 2004.

The RECS also asks occupants if their homes are too drafty during the winter.  Here, the choices are “never,” “some of the time,” “most of the time” and “all of the time.”  Because perception of winter draftiness is likely to depend on the climate, the chart below is based only on single-family detached homes built in the colder climates—defined here as areas with at least 5,500 heating degree days heating degree days, which captures the two coldest of the five climate zones  specified in the RECS data.

Overall, 52.0 percent of occupants report that single-family detached homes built in these climates are never too drafty.  Once again, there is a substantial difference between newer and older homes.  The “never drafty” share is roughly 37 percent for homes built before 1940, climbs to round 55 percent in the 1960s where it remains relatively stable until the 1990s.  The “never drafty” share is about two-thirds for homes built from 1990 to 2004, and then jumps to 81.4 percent for homes built more recently than that.


GAO Report on the 25C Energy Tax Credit Misses the Big Picture

May 9, 2012

Last week, the Government Accountability Office – the audit and evaluation agency of the U.S. Congress – issued a report on the energy-efficient home tax credit, sometimes called the section 25C tax credit. The program rewards homeowners with a tax credit if they make energy-efficient upgrades to their homes. In 2009 and 2010, the tax credit was capped at $1,500. For 2011, the lifetime limit was reduced to $500. The credit expired at the end of 2011.

NAHB has previously examined who claimed the 25C credit, how the credit was used in terms of qualifying products, and the importance of the credit in supporting remodeling spending during the Great Recession.

As enacted, the credit is based on amounts paid for energy-efficient upgrades, rather than the realization of energy savings (performance based), although installation of qualifying upgrades by definition results in improvements of a home’s energy use.

The GAO report on the 25C credit concluded that a performance-based system would provide somewhat greater policy benefits. However, it correctly noted that the administrative cost of a performance-based system (e.g. home energy testing paid for by the homeowner and additional IRS oversight) would be greater for the government and homeowners, perhaps yielding no net benefits.

The rest of the report examined possible changes to the tax rules of 25C. In particular, GAO examined what impacts a floor or base would have on the distribution of credit claims. Under these rules, a taxpayer could only claim the credit for qualified product expenditures in excess of certain thresholds, perhaps defined as a percentage of adjusted gross income. In practice, it would be a very difficult for most taxpayers to calculate what exactly their tax credit would equal under the examined modifications.

In fact, data in the GAO report indicate why both the performance based system and the base/threshold proposal would be counterproductive for the 25C program. The number of taxpayers participating in the 25C tripled from 2008 to 2009. This occurred because legislative changes made by the 2009 stimulus bill made the credit more valuable and simpler to understand. The modifications discussed by GAO in the report would clearly complicate the program, thus lowering participation and undermining its policy objective of improving the energy-efficiency of the nation’s housing stock.

Surprisingly missing from the report is a discussion of the primary challenge for the 25C program: the fact that the tax credit expired at the end of 2011 along with a host of other tax provisions collectively known as the “tax extenders. Failure to extend the 25C tax credit undermines a successful policy that created jobs in the hard hit residential construction sector and yielded long-term gains for homeowners’ energy bills.


Energy Prices Continue to Push CPI Higher

April 13, 2012

The Consumer Price Index for All Urban Consumers (CPI-U) increased 0.3% on a month-to-month basis during March 2012. Once again, energy prices boosted the topline reading on the month-to-month change in price levels, as the CPI for energy jumped 0.9%, after registering a 3.2% increase in February. Retail gasoline prices averaged $3.91 nationally (across all formulations) in March, surging 7.4% versus the previous month. In addition, this marks the third highest monthly reading (in current dollars) for gasoline on record. Prices at the pump have risen an additional 9 cents over the first two weeks of April and the U.S. Energy Information Administration anticipates prices rising further ahead of the Memorial Day holiday. While gasoline prices have exerted some upward pull on overall CPI, natural gas prices have offset this impact to some degree. In fact, the spot price for natural gas recently fell to its lowest point since October 2001 as inventories are seasonally abundant and demand remains weak.

Meanwhile, core CPI, which excludes food and energy goods, increased 0.2% from last month and gained 2.3% on a year-over-year basis. The largest gains were observed for used cars and apparel, but all major categories that make up core CPI experienced increases between February and March. The shelter index, which serves as the broadest measure of housing costs within the CPI, posted a 0.2% increase during March—the same rate of growth that occurred in the 5 prior months. On a year-over-year basis, the shelter index increased 2.1%. With the multifamily sector performing relatively well  compared to the single-family side of the market, rental rates will likely become an important issue as households make the calculus between owning and renting. NAHB’s measure of real rental rates, which is constructed from the CPI for rent of primary residences and overall CPI, fell for the third month in a row during March. While this result suggests apartment demand might be weakening, the recent slippage in the real rent index is likely a result of surging energy prices pushing overall CPI up faster rate than rents.


CPI Holds Steady while Real Rents Notch Third Consecutive Monthly Increase

January 20, 2012

The Bureau of Labor Statistics (BLS) reported the Consumer Price Index for All Urban Consumers (CPI-U) remained unchanged for the second month in a row. An easing in prices across much of the energy commodities complex weighed on topline CPI growth throughout the fourth quarter of 2011, offsetting the gains in the core (all items less food and energy) and food CPIs. For the calendar year as a whole, CPI-U increased 3.2%–roughly double the rate of increase observed during 2010.

Core CPI has posted gains in 35 of the last 36 months, but even with such a long period of nearly uninterrupted growth the overall rate of price level growth for non-food and non-energy consumer goods and services has remained modest. Indeed, compared to December 2010 core CPI has increased 2.2% and at a relatively tepid rate of 1.4% per annum since 2008.

Among the various subcomponents of core CPI, the indexes for shelter, recreation, medical care, and tobacco all posted increases, offsetting weaker readings for used cars and trucks, new vehicles, and apparel. The shelter index registered its 16th consecutive month-to-month increase, but as has been the case with many types of consumer goods and services, the rate of increase has been modest with a gain of 1.3% for calendar year 2011.

With apartment vacancy rates tightening appreciably over the past few quarters, rental rates have started to rebound. Indeed, NAHB’s measure of real rental rates, which is constructed from the CPI for rent of primary residences and overall CPI, increased at an average annualized rate of 2.6% during the fourth quarter of 2011. Apartment vacancy rates could decline further over the course of 2012 as household formations among the key renter age cohorts recover. In turn, real rents would likely increase over the near term.


How Did Homeowners Use the Remodeling Tax Credit?

September 27, 2011

In a previous Eye on Housing post, NAHB examined the geographic distribution of 2009 claims of the $1,500 remodeling tax credit. We now have data from the IRS on specific kinds of energy-efficient and energy producing equipment that was installed in homes to qualify for the program, as reported on IRS Form 5695 (hat tip to Charlie McCrudden of the Air Conditioning Contractors of America for distributing the IRS data).

With respect to the 25C credit for energy-efficient remodeling of existing homes, the data indicate a total of $25.1 billion of qualified expenditures in 2009. This an enormous amount of activity connected to the tax credit program, especially when considering that according to NAHB estimates every $100,000 in remodeling expenditures generates 1.11 full-time jobs.

Because the tax credit in 2009 was limited to $1,500 per taxpayer, not all of this activity generated tax credits. In fact, according to the IRS data, just a little more than 71% of these costs ($5.404 billion versus potential $7.539 billion) were allowed in the 25C calculation due to the $1,500 limit. Moreover, due to other tax rules only $5.172 of the $5.404 billion were allowed as realized as final 25C tax credits.

The first portion of the 25C credit is due to energy-efficient building envelope improvements, with 13% of the 25C claims associated with insulation, 34% with windows and skylights, 9% with doors and another 9% with qualified roofing materials. The second part of the credit dealt with energy-saving appliance installation, with 16% of the total 25C claims connected to heat pumps, air conditioners, water heaters and stoves; 17% with hot water boilers; 3% with air circulating fans used with a natural gas, propane or oil furnace.

The 25D program, which provides a tax credit for the installation of certain power producing property in new and existing homes, is a somewhat smaller program. For 2009 installations, a total of $738 million of 25D tax credits were claimed (with an additional $69 million of 25D credits carried-forward from prior tax years). Of this total, 45% came from solar panels, 9 percent from solar water heaters, less than 2 percent from wind turbines, a surprising 45% from geothermal heat pumps and 1 percent from fuel cell property.

For more information on both tax credit programs, NAHB has published the following fact sheet.