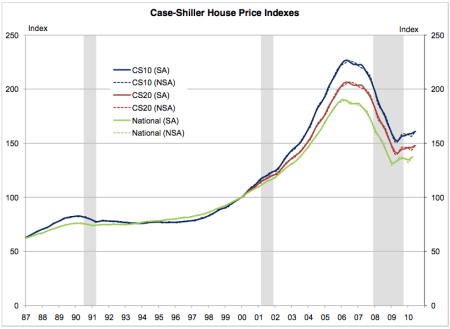
The Standard and Poor’s release of the Case-Shiller Home Price Index (HPI) indicates that house prices rose strongly in June. The quarterly National Index rose 4.7% in the second quarter from the first quarter on a non-seasonally adjusted basis (NSA) and 2.3% on a seasonally adjusted basis (SA). The monthly Composite 10 and Composite 20 indexes both rose 1.0% from May to June, and 3.1% and 3.2%, respectively, in the three months from April to June (NSA). On a seasonally adjusted basis, the Composite 10 and Composite 20 indexes were essentially flat (up 0.3%) for the month, and up 1.4% for the three months ending in June. Prices were up in 17 of the 20 cities covered by the index on a non-seasonally adjusted basis (10 of the 20 cities on a seasonally adjusted basis).
The S&P Case-Shiller HPIs are considered to be among of the more reliable and consistent of the array of HPI’s available for the United States housing market. They measure the change in the market value of existing single-family homes using a “repeat sales method” observing the change in price of the same property between two sales, thus better capturing the true appreciated value of a property. In comparison the National Association of Realtors median home price series is subject to distortion based on the composition of sales (e.g., size, geography, etc.). The composite indexes include price data from 10 and 20 large metropolitan statistical areas (MSAs) across the United States. The national index is based on a larger, more geographically diverse sample.
There is considerable divergence between the seasonally adjusted and non-seasonally adjusted HPIs. This is similar to the situation observed with the FHFA HPI. Analysis of the seasonal adjustment process and its influence over the Case-Shiller HPI in a report recently posted on the Standard and Poor’s website identified “turmoil in the housing market in the last few years has generated unusual movements that are easily mistaken for the normal seasonal patterns, resulting in larger seasonal adjustments and misleading results.” Therefore, it is suggested that when observing the Case-Shiller HPI attention should be focused on the non-seasonally adjusted numbers.
After reaching the trough in Spring 2009, house prices have shown moderate growth, despite some month-to-month volatility. The Composite 10 index and Composite 20 index are up 7.0% and 6.3%, respectively, from April 2009 to June 2010 (NSA). The National Index is up 6.8% from its March 2009 trough (NSA).
Year-over-year prices have increased in 16 of the 20 MSAs (NSA), with the strongest growth observed in California MSAs (LA 9%, San Francisco 14% and San Diego 11%) and Minneapolis MN (11%). The weakest markets include Tampa, FL (-2%), Charlotte, NC (-3%), Las Vegas, NV (-5%) and Seattle, WA (-2%).
A key point to recognize in today’s release is that house prices have followed the same pattern of surge and softness seen in other housing market indicators (e.g., housing starts and sales of new and existing units) reflecting the support and withdrawal of support from the home buyer tax credit. House prices in June may be still reflecting the support provided by the tax credit and the coming months may show retrenchment similar to that seen in other indicators. We expect any near term declines to be mild and temporary. What is clear from the price movements in the indexes since their respective troughs is that the volatility follows the pattern of the timing of the tax credit, but more importantly that the underlying trend is upward.
Add to this the two points that in most parts of the country house prices have returned to what can be loosely described as pre-boom levels, and that a consensus of forecasters polled by Standard and Poor’s believe that house prices will continue to rise for the next several years, and we can probably feel comfortable about where house prices are headed, in spite of the weakness we have seen in some of the other indicators.
Robert Denk also contributed to this Post


[…] falling 0.2% and the Composite 10 (CS10) index down 0.1% on a non-seasonally adjusted basis (NSA). (As noted in the past, when observing the Case-Shiller HPI attention should be focused on the NSA numbers). However, the […]
[…] (CS20) falling 1.3% (not seasonally adjusted) and the Composite 10 (CS10) index down 1.2% (NSA). (As noted in the past, when observing the Case-Shiller HPI attention should be focused on the NSA numbers.) This is the […]
[…] and 0.8% to 157.7 for the Composite 10 (CS10) index on a not seasonally adjusted basis (NSA). (As noted in the past, when observing the Case-Shiller HPI attention should be focused on the NSA numbers, and although […]